
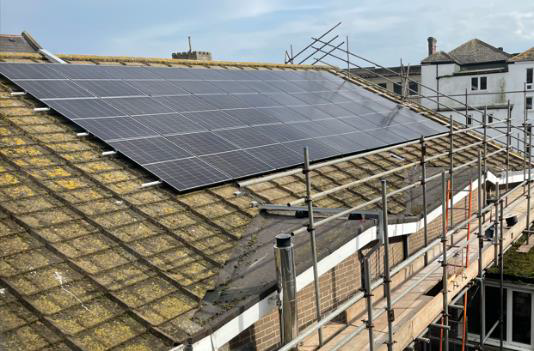
They’ve arrived!
Our 60 solar panels have now been installed and working for the last
week or so. The Sungift installation team did a great job and soon we were generating electricity. So far, the panels have supplied 54% of the Mint’s electricity use. The panels come with a handy phone app which shows you in real time how much is being generated, how much is being used, and how much is stored in the batteries. It’s quite addictive! Ask me if you want to see. Here are some screen shots showing performance so far.
Electricity generated
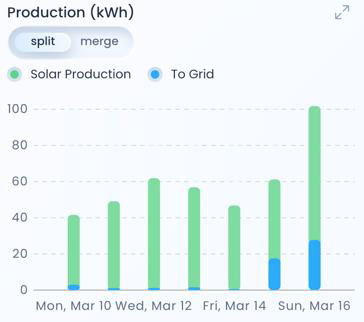
This chart shows the kWh generated, with a column for each day so far. This varies significantly according to how sunny the day is, but you can see that even in mid-March on the better days we are exporting surplus energy to the Grid (after first topping up our battery storage).
Electricity consumed
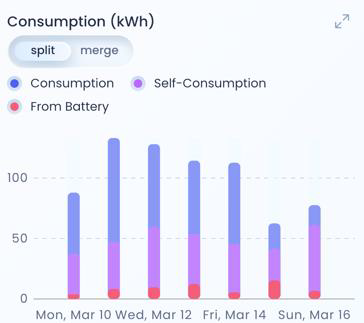
This is just as interesting. It is informative on the live app to see power consumption going up when a kettle boils. The chart shows our electricity consumption each day, with the purple at the bottom of each bar showing how much we have generated from the solar panels. On the sunnier days, as much as 80% of our electricity has come from the panels.
This will significantly reduce the Mint’s electricity bills and its carbon emissions.
Martin Easton